How can I get the application logs?
Viewing the logs
Web browsers provide a JavaScript console as part of their developer tools. This console is useful for the following reasons:
- Errors and warnings that occur on a web page are logged into the console.
- If needed, JavaScript commands for interacting with a web page can be executed in the console.
These logs from the console can be copied to add to your query when requested by us.
To open this console, the keyboard shortcuts are different per browser:
1) CHROME:
Opening the “Console” panel of Chrome’s DevTools:
Windows and Linux: Ctrl + Shift + J
Mac OS: Cmd + Opt + J
Note: In addition to the “Console” panel, there also exists a smaller slide-up console which can be toggled via Esc while any of the other panels is active.
Full documentation (see below a summary on how to enable more logging on chrome)
2) FIREFORX:
Opening the “Console” panel in Firefox’s Developer Tools:
Windows: Ctrl + Shift + K
Mac OS: Cmd + Opt + K
Note: In addition to the “Console” panel, there also exists a smaller slide-up console which can be toggled via Esc while any of the other panels is active.
3) SAFARI:
Note: In order to view the console in Safari, you have to enable the “Show Develop menu in menu bar” setting in the “Advanced” pane of Safari’s preferences (screenshot).
Opening the “Console” panel in Safari’s Web Inspector:
- Cmd + Opt + C
Note: In addition to the “Console” panel, there also exists a smaller slide-up console which can be toggled via Esc while any of the other panels is active.
Collecting even more details using chrome
In some support cases we might ask you to send us browser logs so we can see what is happening on your machine. Follow these steps to export the logs as a file and send it to us:
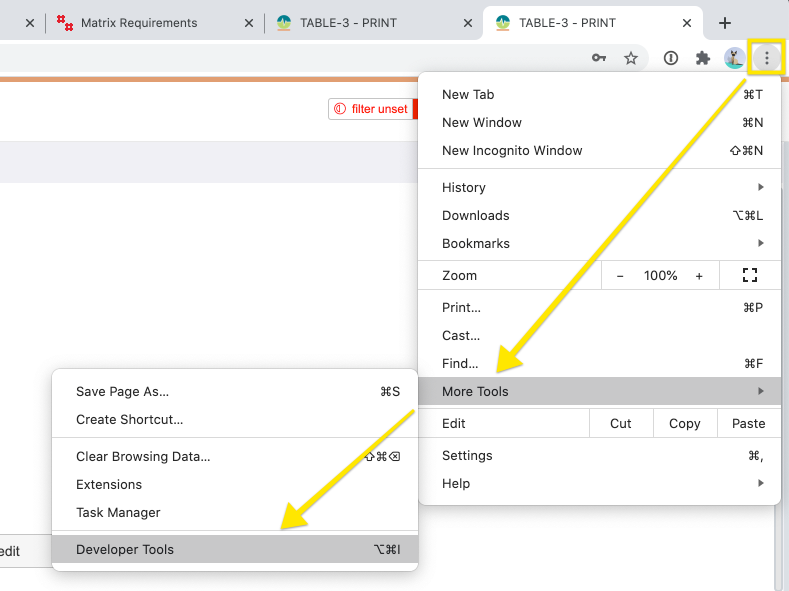
Open the Chrome Developer Tools
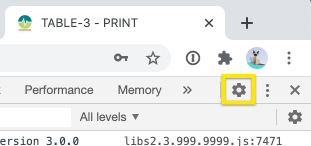
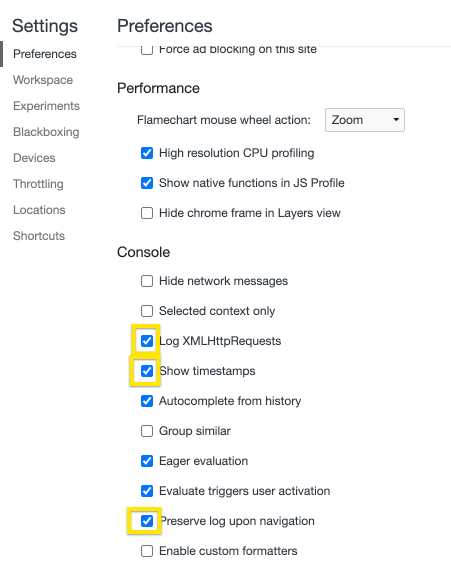
Click on the Settings icon to adjust what is logged and make sure the following options are checked:
Click through the steps to reproduce the problem then switch to the “Console” tab in the Developer Tools and right click somewhere in the log. Make sure that the Filter is set to “All levels”, then select the Save As… option and save the file somewhere on your disk.

Compress the log as a zip file using the tool of your choice, then send it to us.
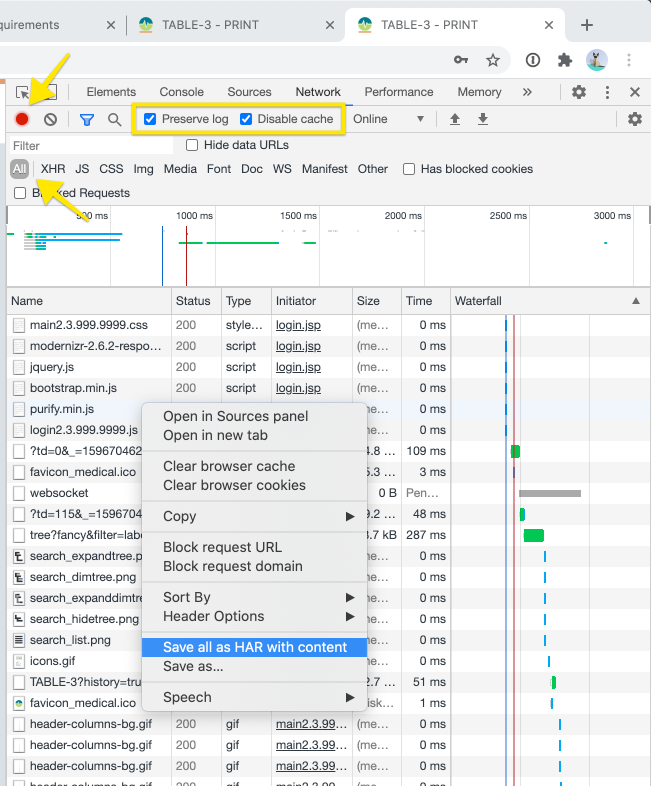
Collecting the network log
In some cases we might ask you for the network log in addition to the console log. To save the network log follow these steps:
Open the Developer Tools (see above)
Open the Network tab and make sure the “Preserve log” and “Disable cache” options are enabled
Make sure recording is on (Red circle on the top left) and the filter is set to “All”
Use the app to reproduce the error
Right click and select “Save all as HAR with content”
Zip the resulting file and send it to us